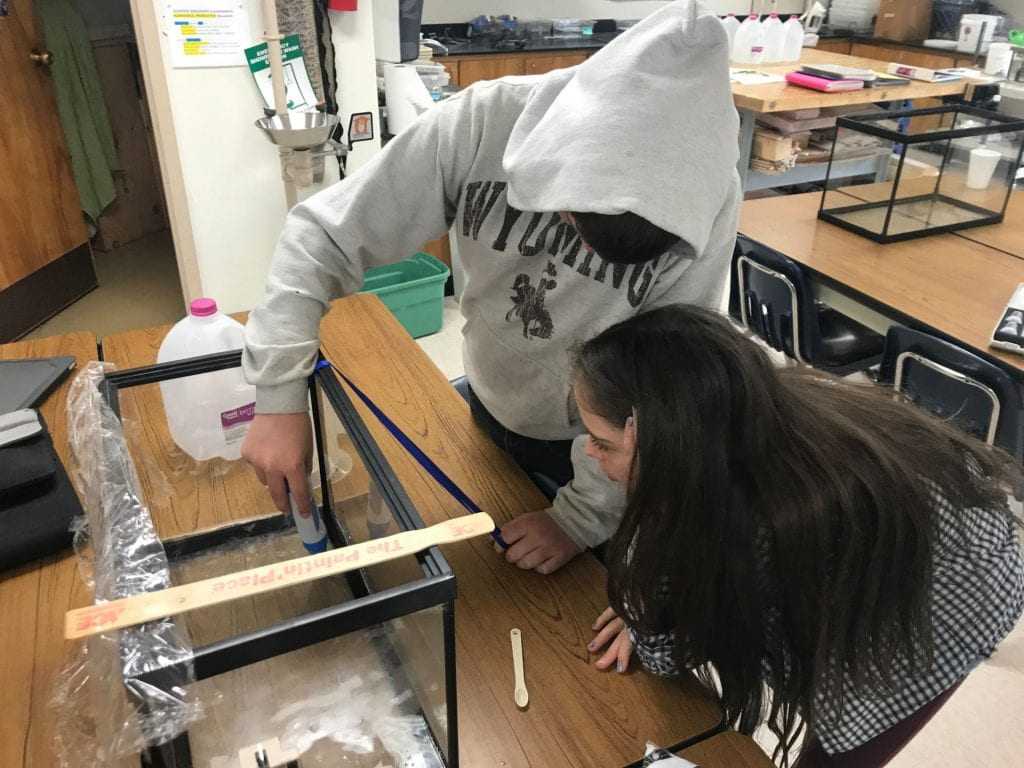
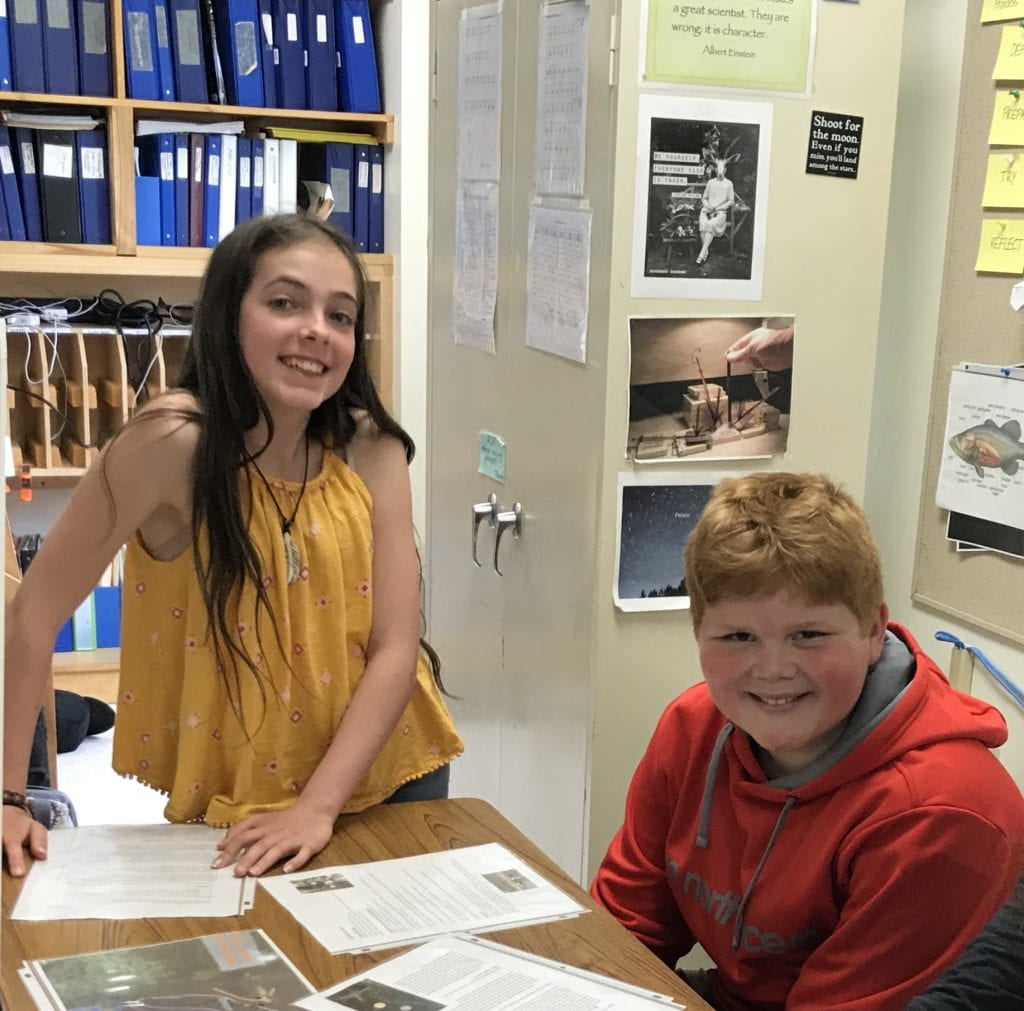
Our Celebration of Learning on June 13th, 2019 was a rewarding experience! We had many guests visit our classroom, including representatives from the Natural Resources Council of Maine who supported our project with grant money. Students greeted, guided visitors to numerous stations around the room to see the different facets of our work investigating the salinity effects to alewife reproduction in the marsh. On display were our aquariums with varying salinities and demonstrations of daily observations, data gathering and feeding methods. 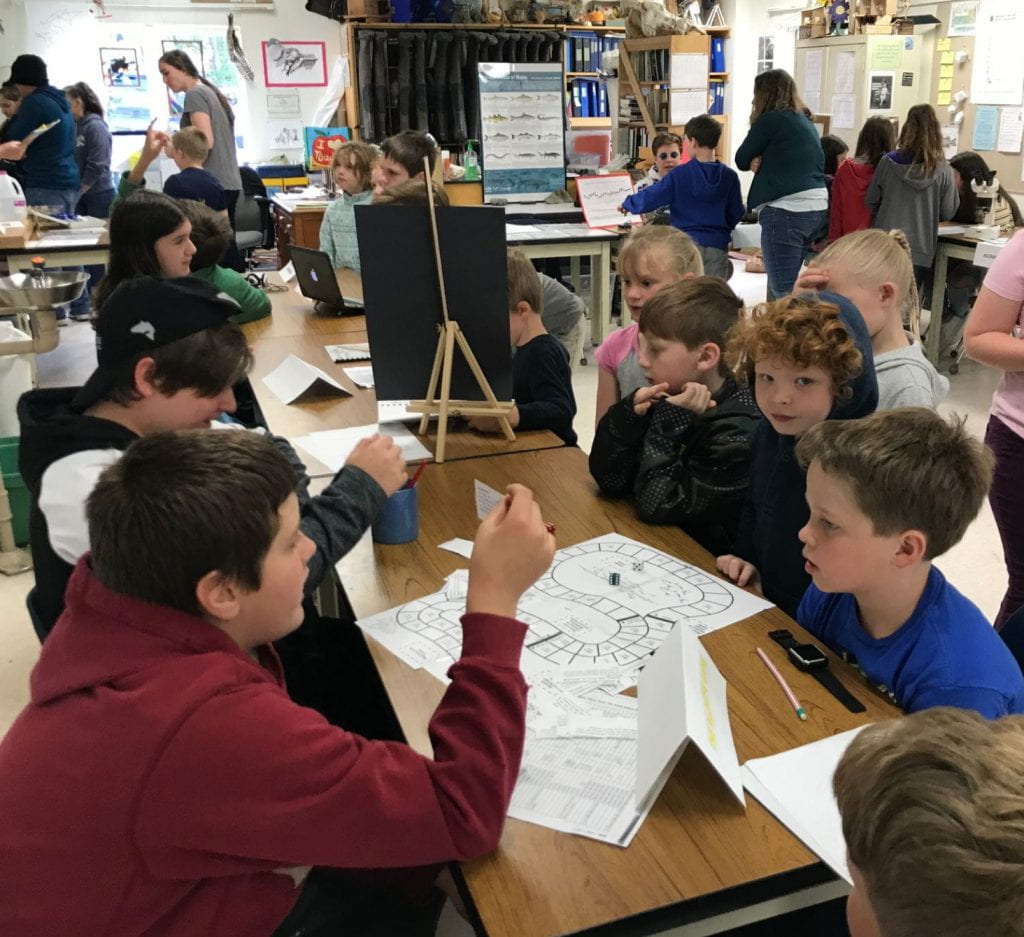


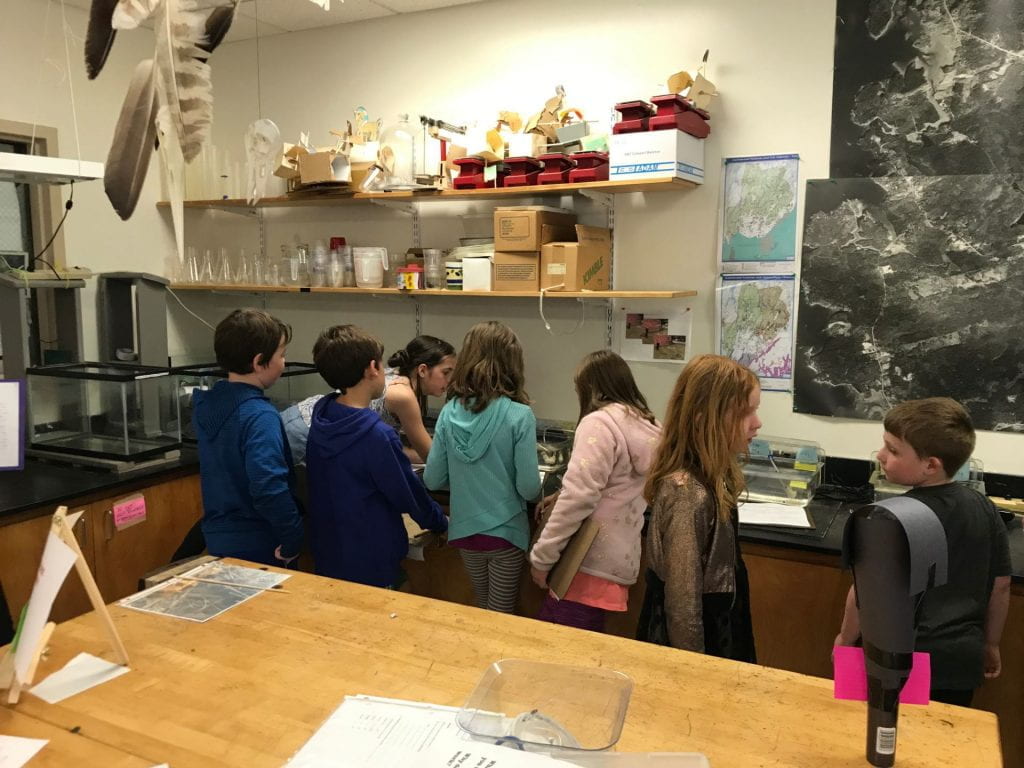


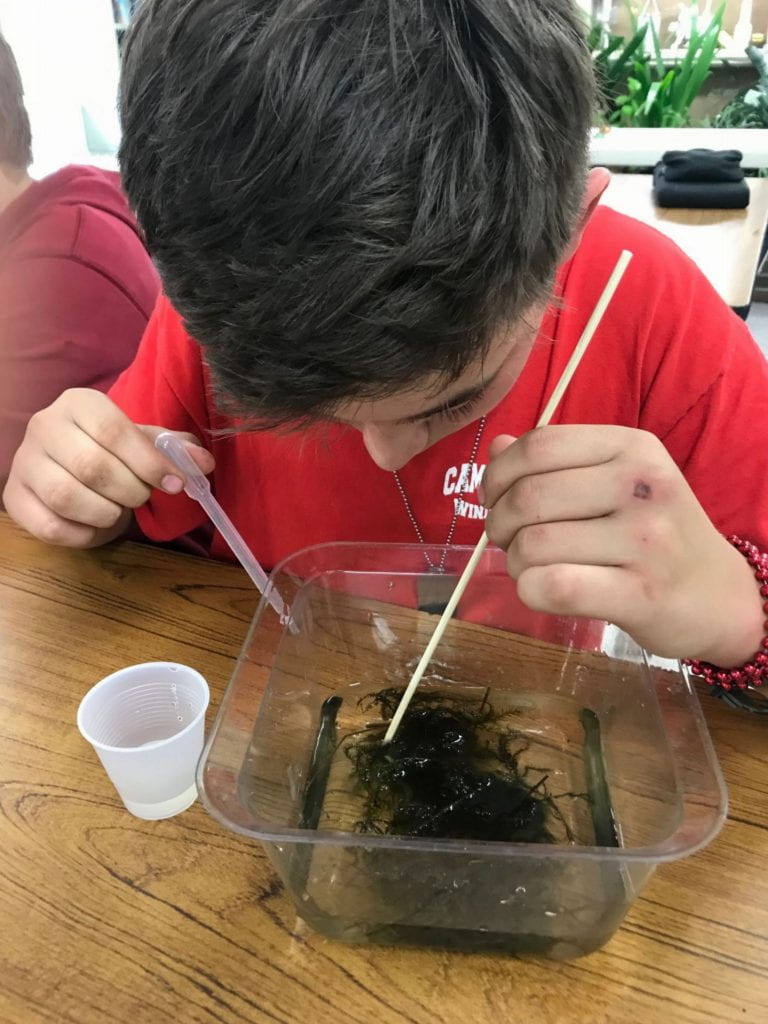
A clever zooplankton viewer was rigged up by Jayden to make it very easy to see the natural food of alewife fry.

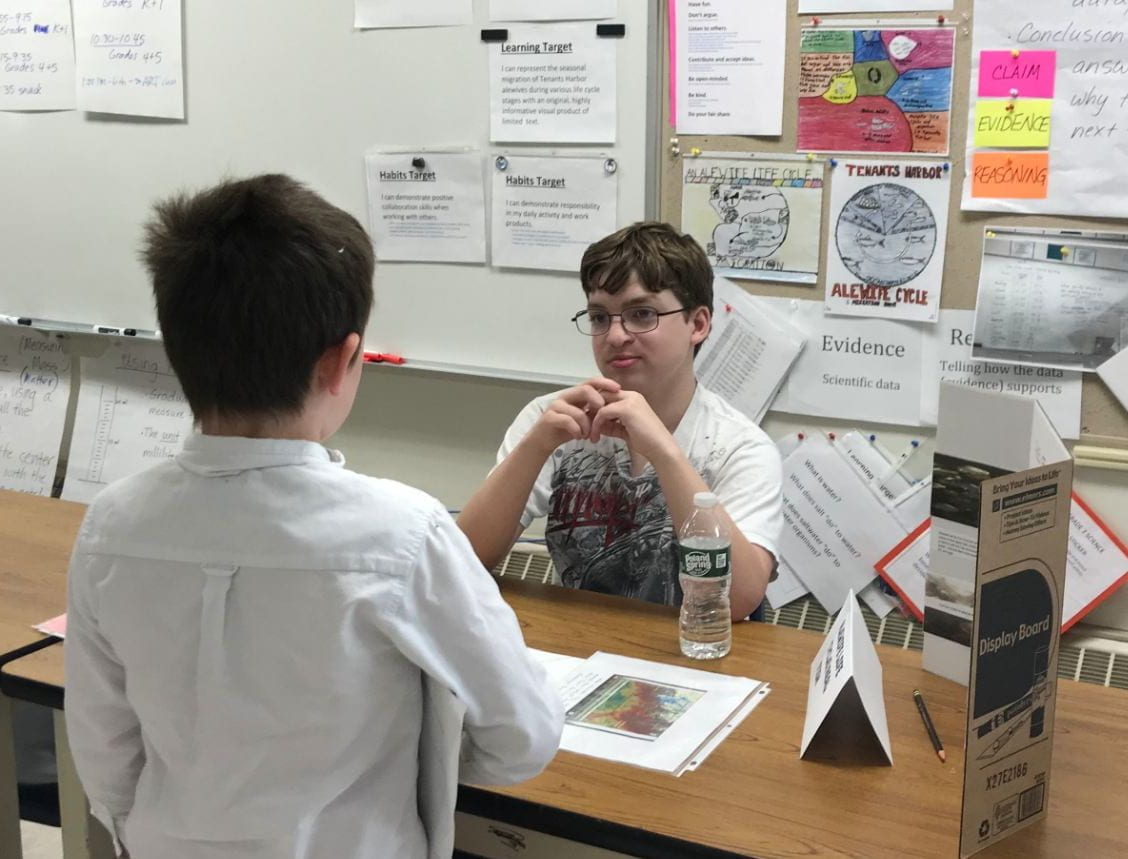
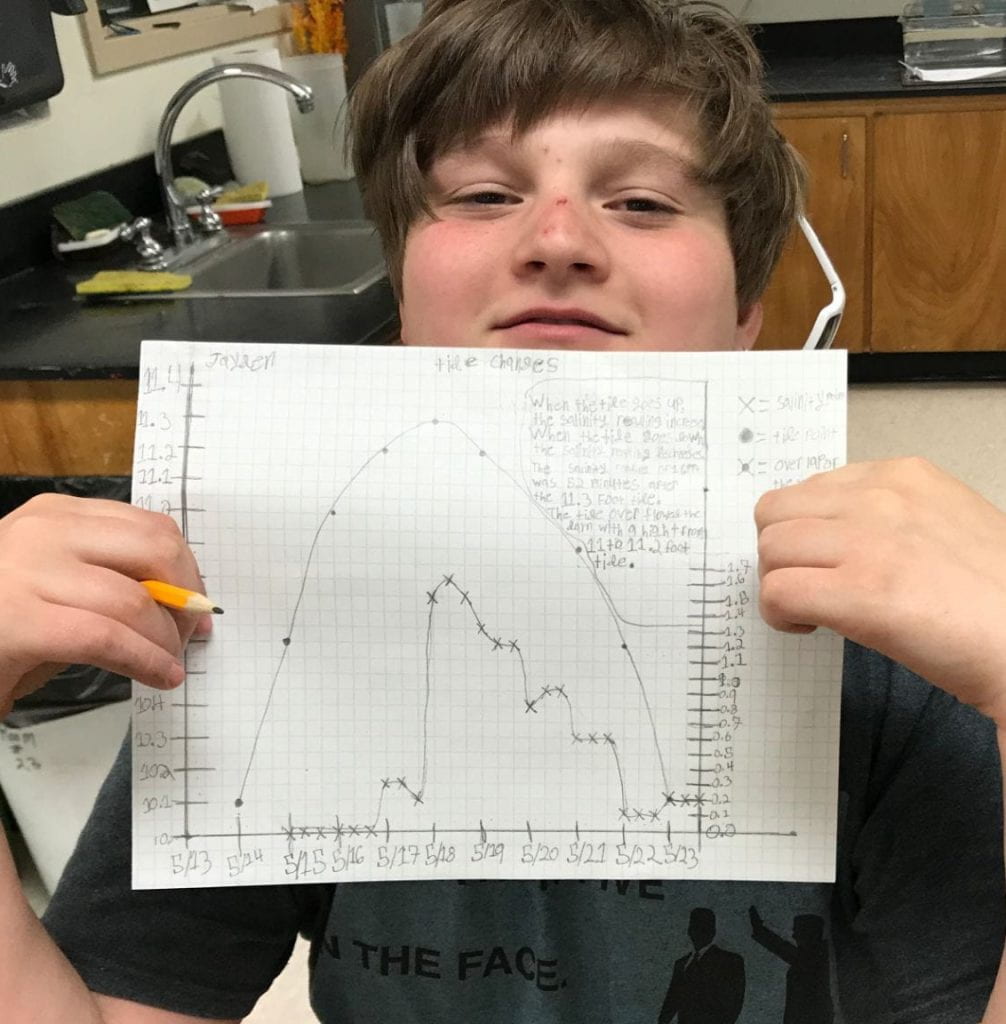
 How we measure salinity with a refractometer and how we monitor our aquarium salinities with our digital hand-held probe was demonstrated; our data from May as well as graphs and data analysis and claims were on display…Bryson had his Maker Space probe to talk to people about, as well as a display of June’s temperature, salinity and tide height data.


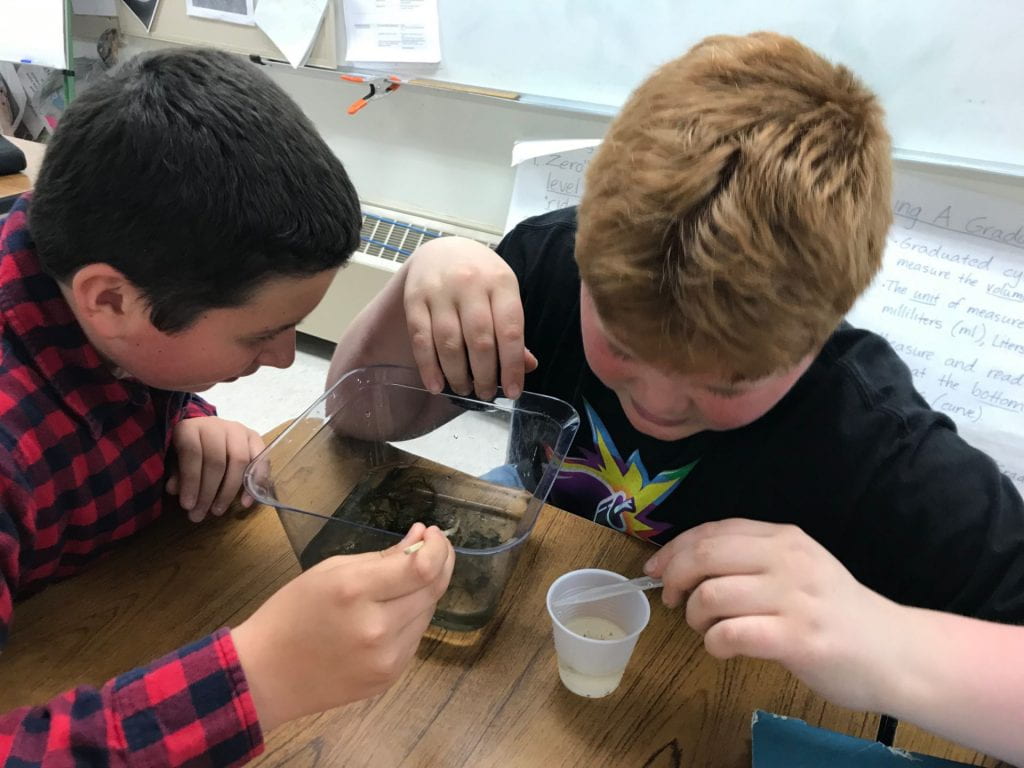
We had a live demonstration of how we identify alewives and their gender as well as otolith removal. Otoliths are the earbones of fish and can give researchers an amazingly detailed analysis of the age of the fish and the waters in which it has lived. Scale sampling and aging techniques via our classroom microscope were also on hand.


Our life cycle informational graphic displays were there to see and rounding out our displays were our Nature Notes, soon to be published by the Gulf of Maine Natural Resources Institute and their Vital Signs program.


We’d like to thank our visitors and our community for supporting our learning efforts!
Note: Here is a link to our published Nature Notes in the middle level science journal “Findings From the Field” (Vol. 2).


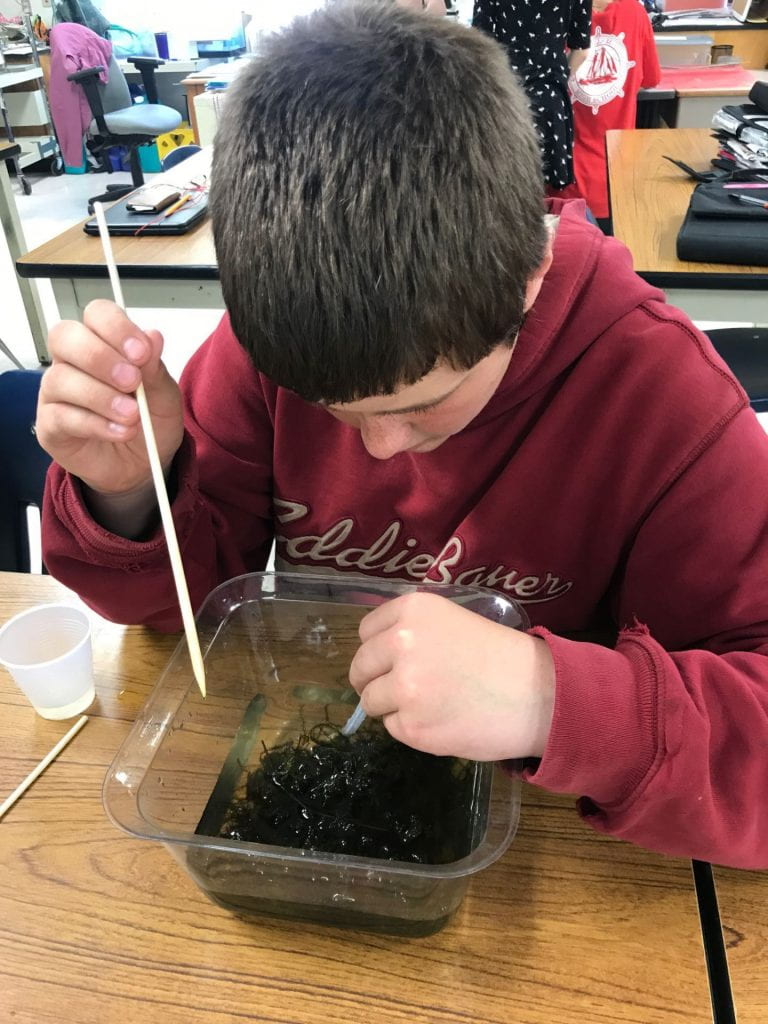
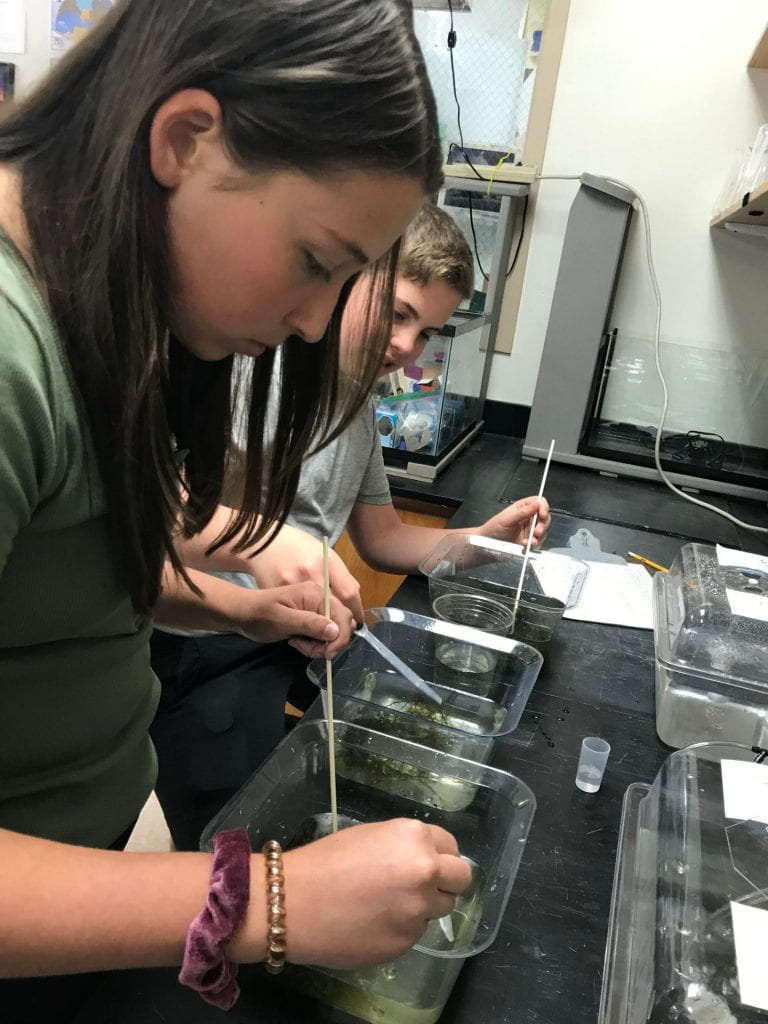


 We are now in LAB mode! The alewives are spawning in North Pond, where we have a collection permit, and we have some eggs in a bucket (with the cool spring, the eggs have not concentrated in the waters making collection challenging). Now we need to set up our aquariums with the different amounts of salt we have decided for each tank. Our question is: Will a salinity greater than 2.0 ppt affect the survival of alewife eggs or fry? Most classmates think that salinities greater than 2.0 ppt will decrease the survival of eggs and fry.(Substitute student hypothesis here?) The question and our hypothesis was framed and informed by published results of the few previous salinity studies (a peer review process!) that we found.