
One our big goals this spring was to collect salinity data during the spring tides of May and June. We met that goal with the deployment of the Maker Space digital salinity probe. The data card yielded the following analysis, which is promising for the alewives.
Here are two student claims about our data.
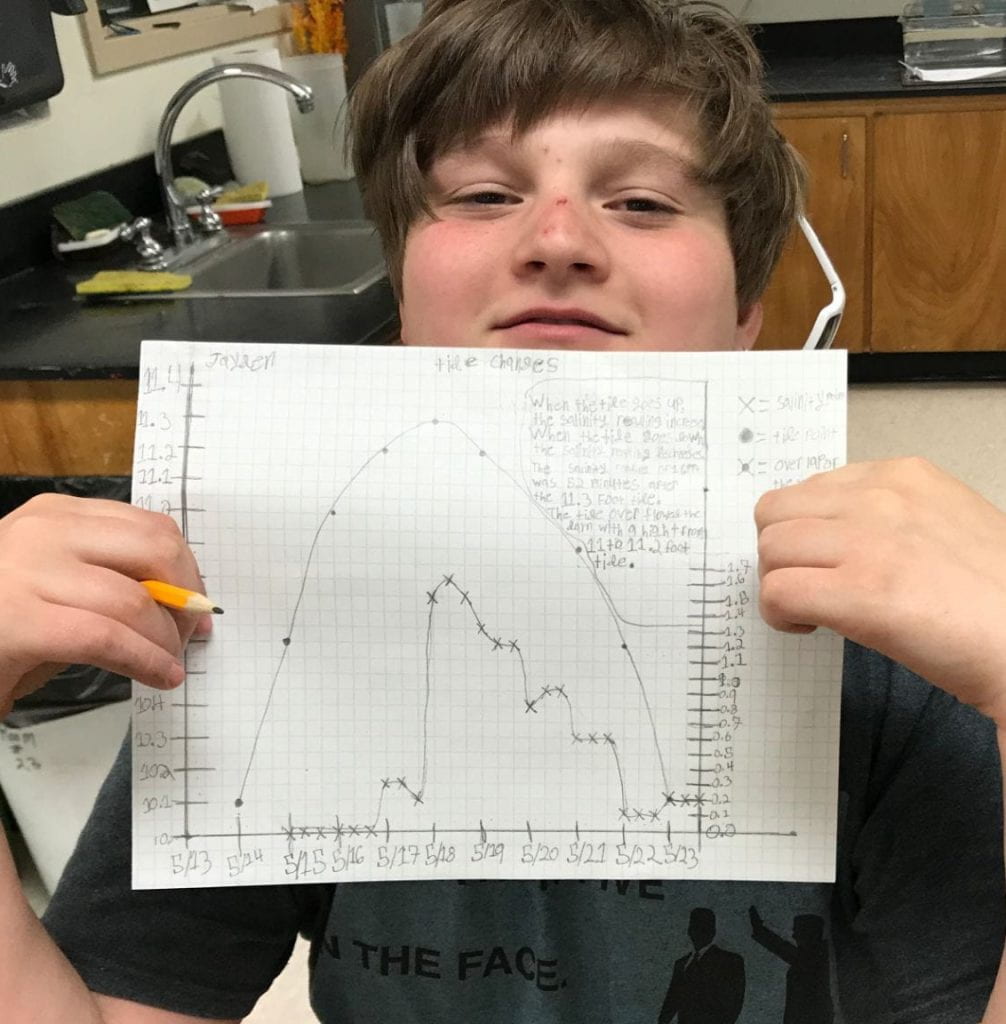
A graph displaying the changes in the height of the tides and the changes in salinity, May 14th – 23rd, 2019

Two small alewife fry, approximately 2 cm in length, swimming against the backdrop of our data sheet!
The Salinity Claims about our Marsh (Ella)
We were able to collect data from our Maker Space probe, here is what we got:
During the May spring tides there was salt brought into our marsh. Our evidence is the data collected from salinity probe. We made a graph to show what the salinity was day to day from May 8th to May 23rd. On the day of the spring tide, May 18th the salinity shot up from 0.3 PPT to 1.6PPT. On this day the height of the tide was 11.3 feet.
On our graph we saw that the height of the tide is the independent variable and the salinity is the dependent variable. That means that the salinity depends on the height of the tide. For an example, when the height of the tide is increasing then than the salinity would also be increasing. For an example on May 17th we had an 11 ft tide and the salinity was 0.3 PPT. Then as the tide increased on May 19th to an 11.3 ft tide with a salinity of 1.3.
The salinity of the marsh changed quickly, in small amounts. Our evidence is, in the days between May 17th – May 2oth. There was a range of 0.1 PPT over 3 different samples in a 40 minute period. This proves that our salinity probe can measure small amounts of salt at short period of time.
Salinity Data (Brooke)
The May 2019 spring tides brought salt in to our marsh. We gathered all of our data in the marsh from the salinity probe built in the Maker Space by a classmate. The highest spring tide was 11.3 ft on the 18th with a salinity of 1.6 parts per thousand (ppt).
There is a positive relationship between the height of the tide and the salinity in the marsh. When the height of the tide gets bigger, the salinity increases. When the height of the tide is decreasing, the salinity decreases. For example, on May 19th the tide was 10.6 ft and the salinity was 1.2 ppt. The next day on the 20th, the height of the tide was 10.4 ft and the salinity was 0.8 ppt.
The salinity changed by small amounts in short amounts of time. From May 17th-20th, for the first forty minutes of each day the salinity changed by 0.1 ppt.
If we had eggs in our marsh they should be able to survive the 1.6 ppt salinity that was measured in May, based on two professional science studies that found eggs can survive in salinities under 2.0 ppt. We read about these studies before setting up our tanks in our classroom.