Salinity Check, June 14th with Alewives in the Marsh

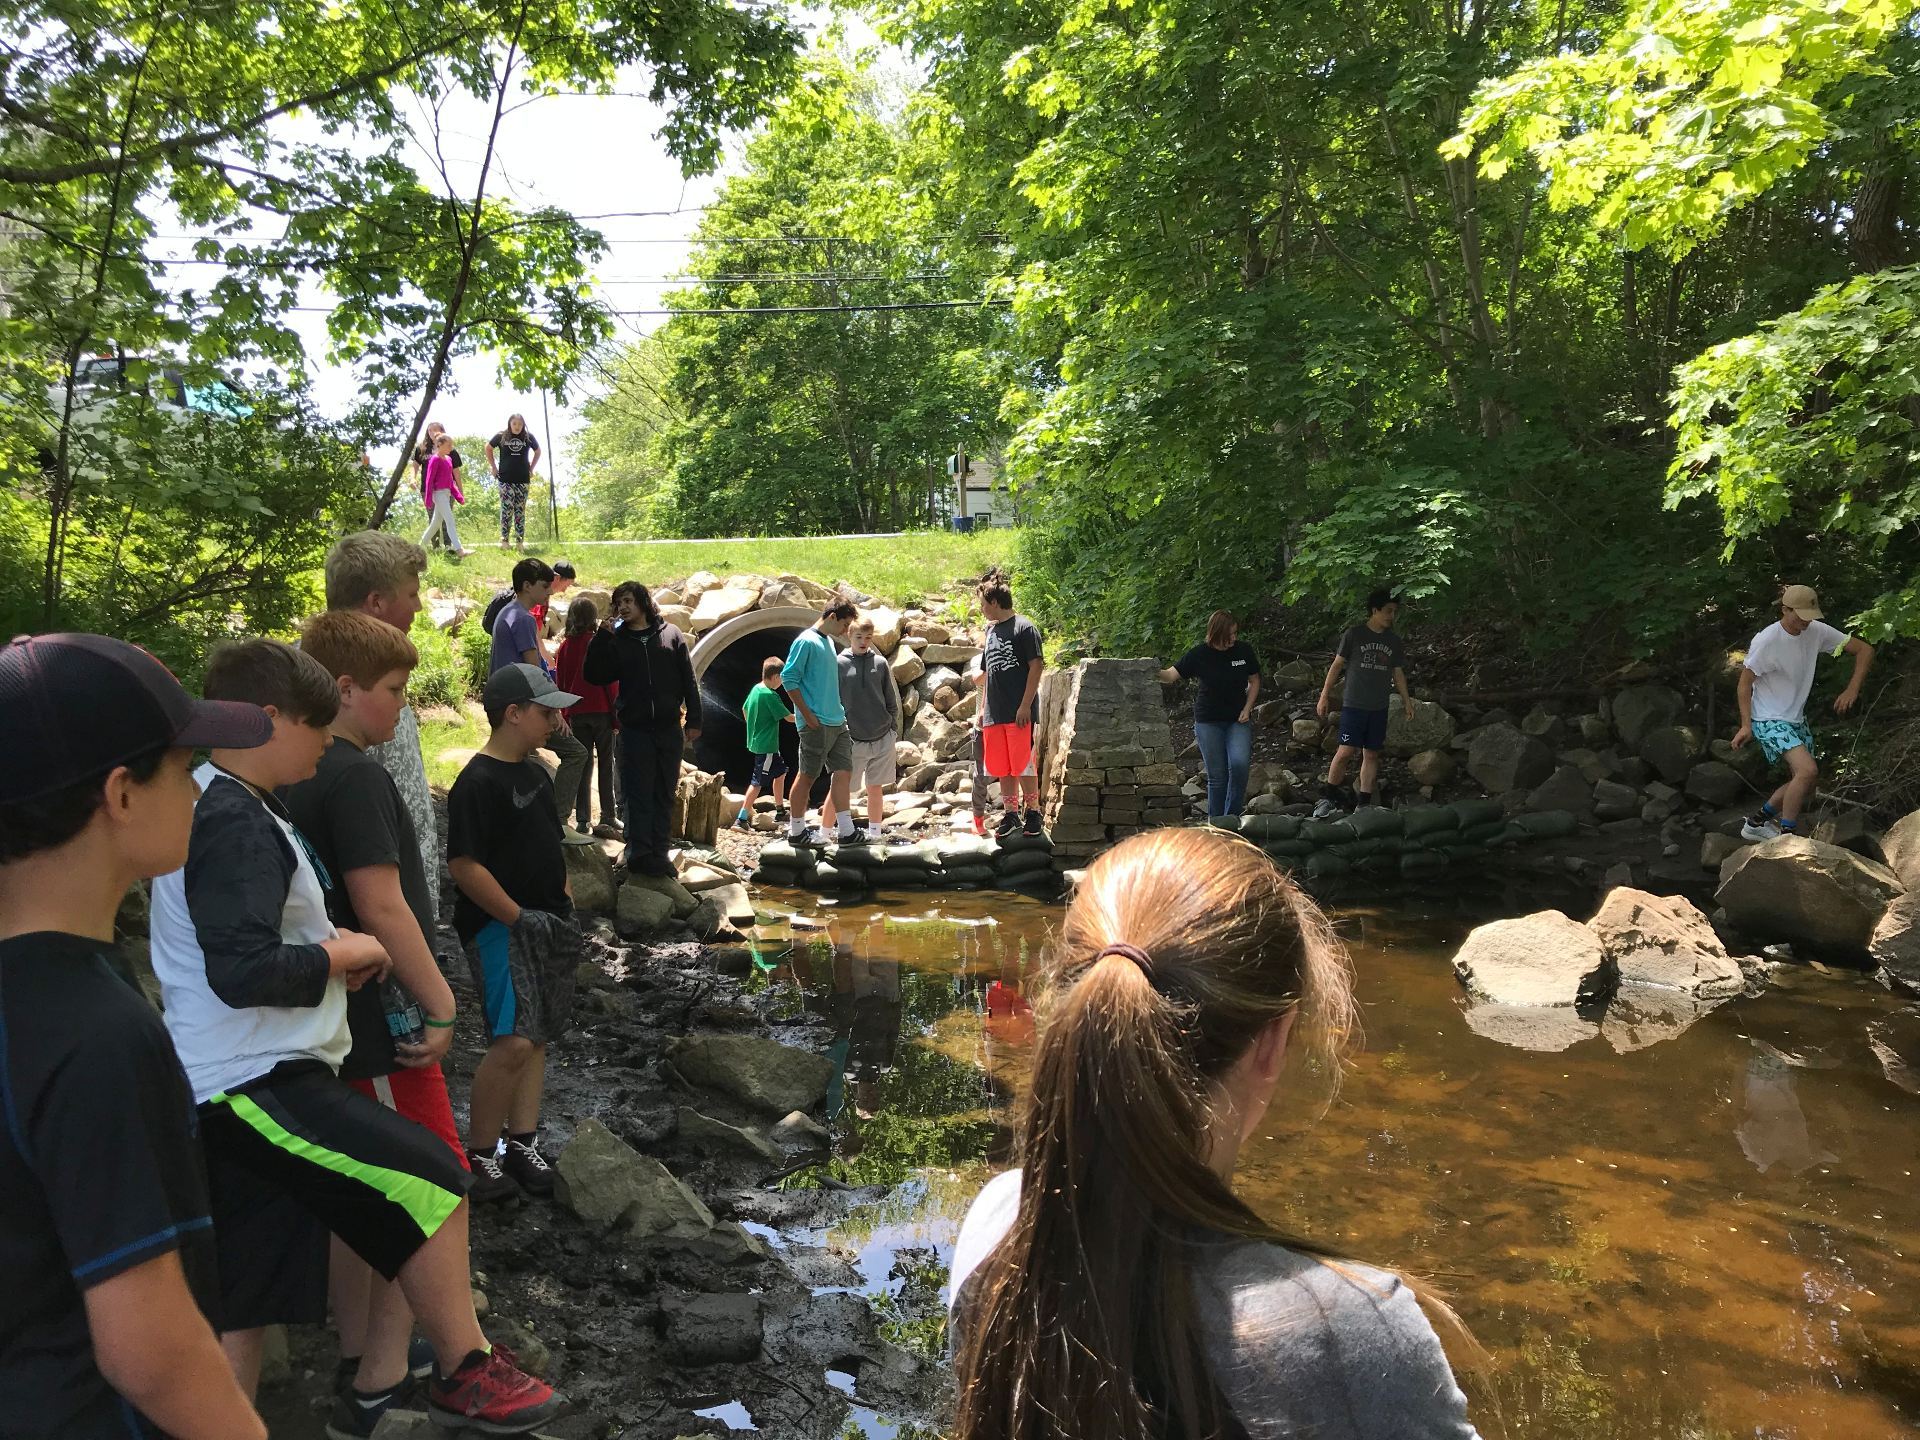
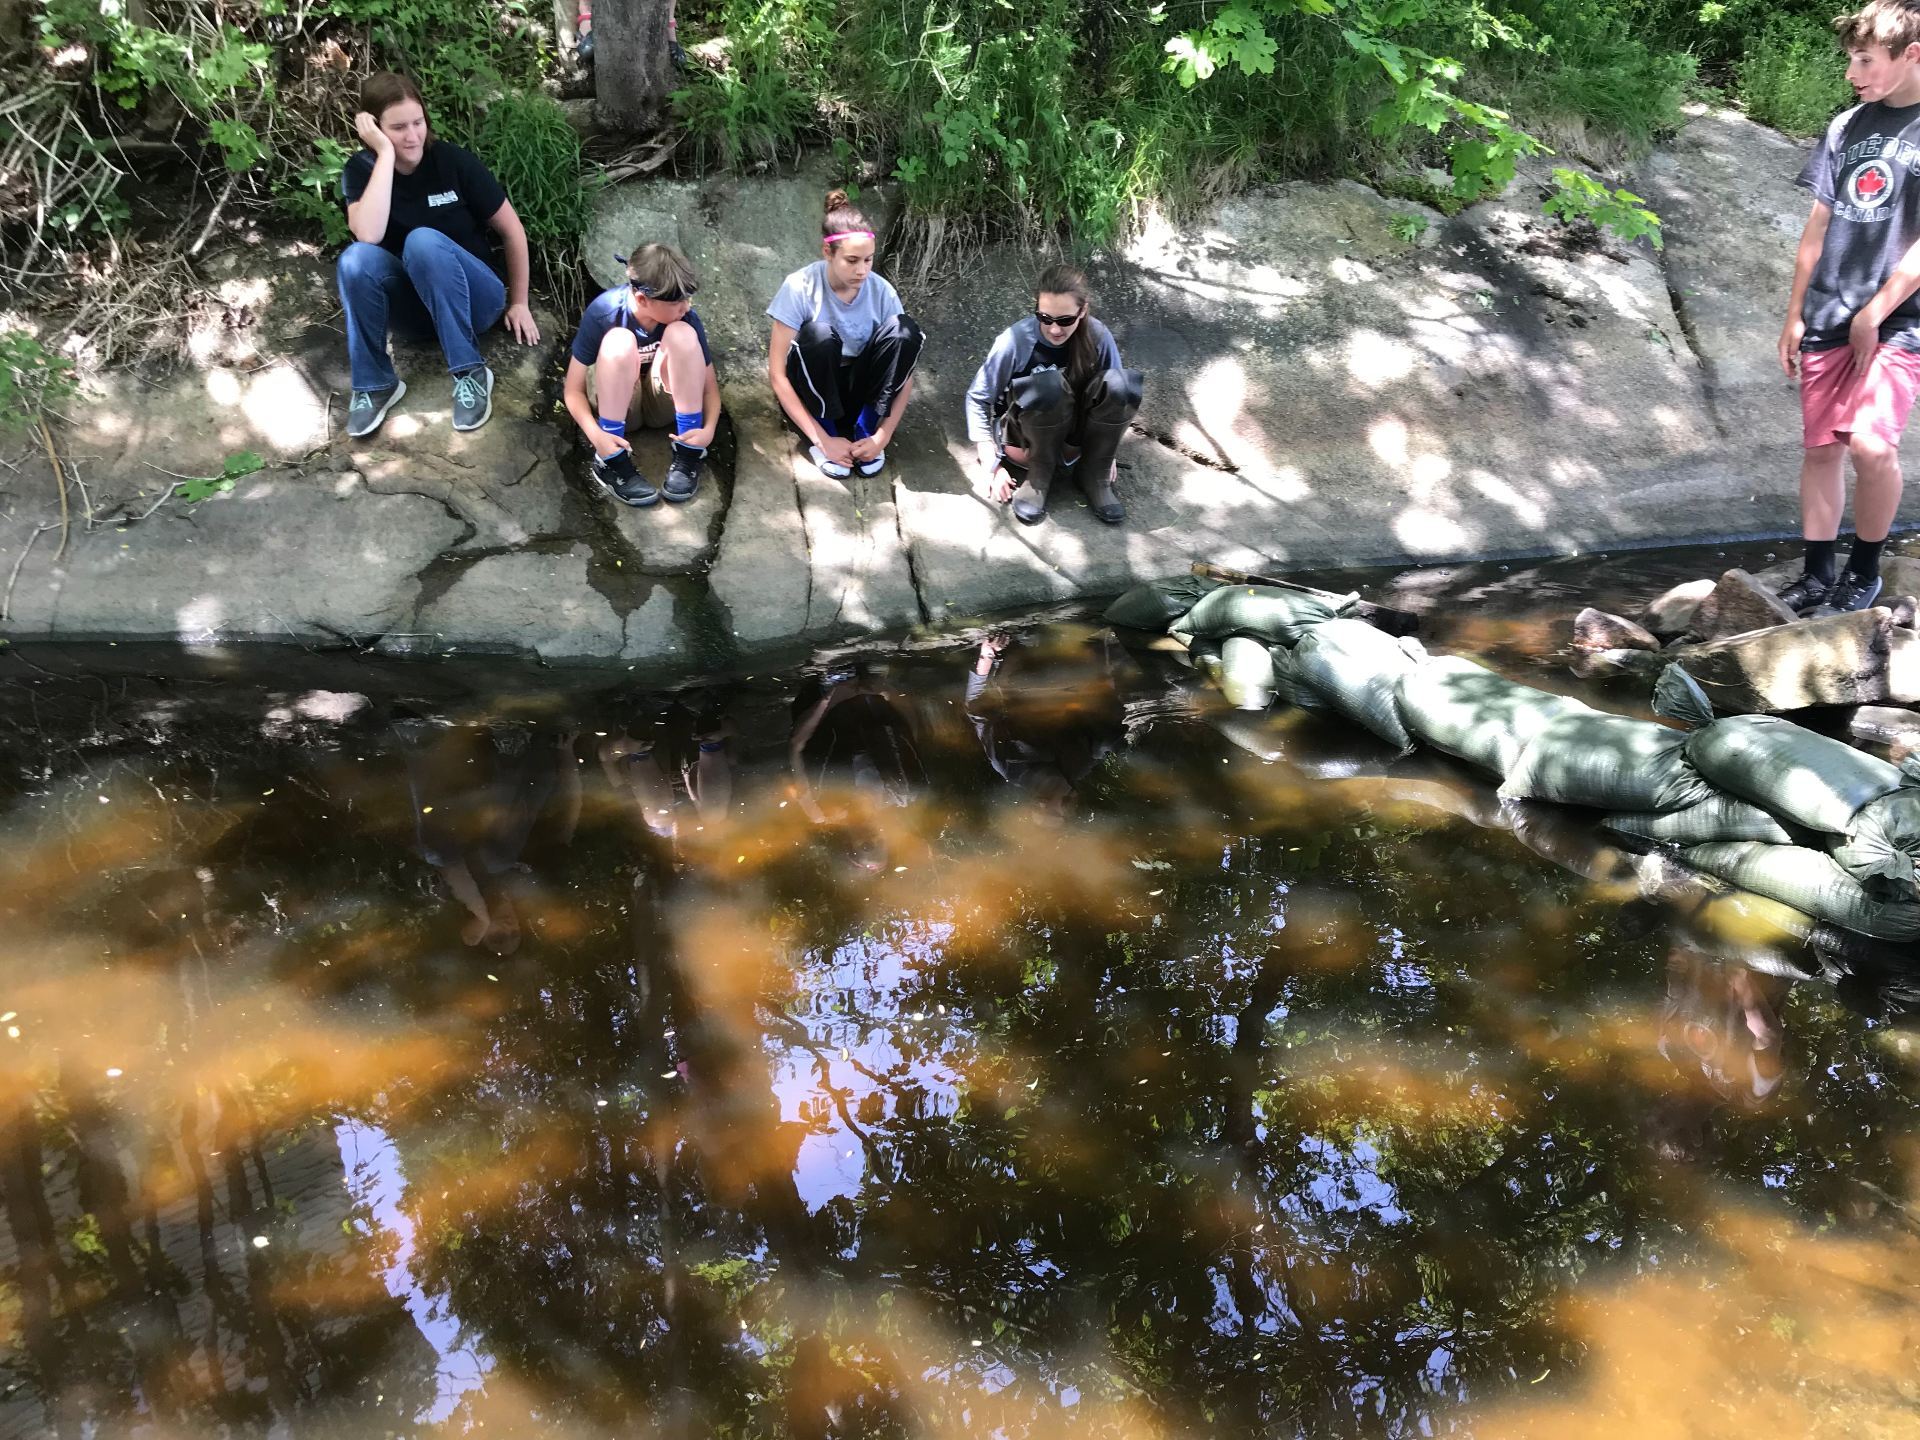
As of June 12th, we can confirm that two alewives are in the marsh.  They were spotted in the culvert the evening of June 11th, and netted at midday on June 12th, and placed in the marsh, thanks to the efforts of the students in both grades 7 and 8.  They were in the stream, circling and running up to the base of the installed “slide”, but did not have the aid of the tide that day to help them over.  Water flowing out of the marsh was minimal and could not help them over.   This date is much later than two years ago, when we observed several groups of fish over the couple days starting May 25th, 2016.

The bigger tides of the month that bring water directly in the marsh are tides greater than 10.3 feet (see our post on June 3rd). These tides were just after the appearance of these two alewives.  The flooding tides occurred on the night of June 12th and continued through June 19th, with at least one flooding tide per day.

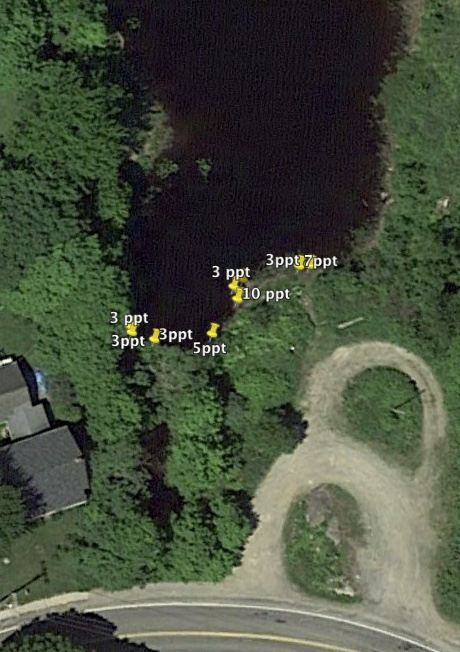
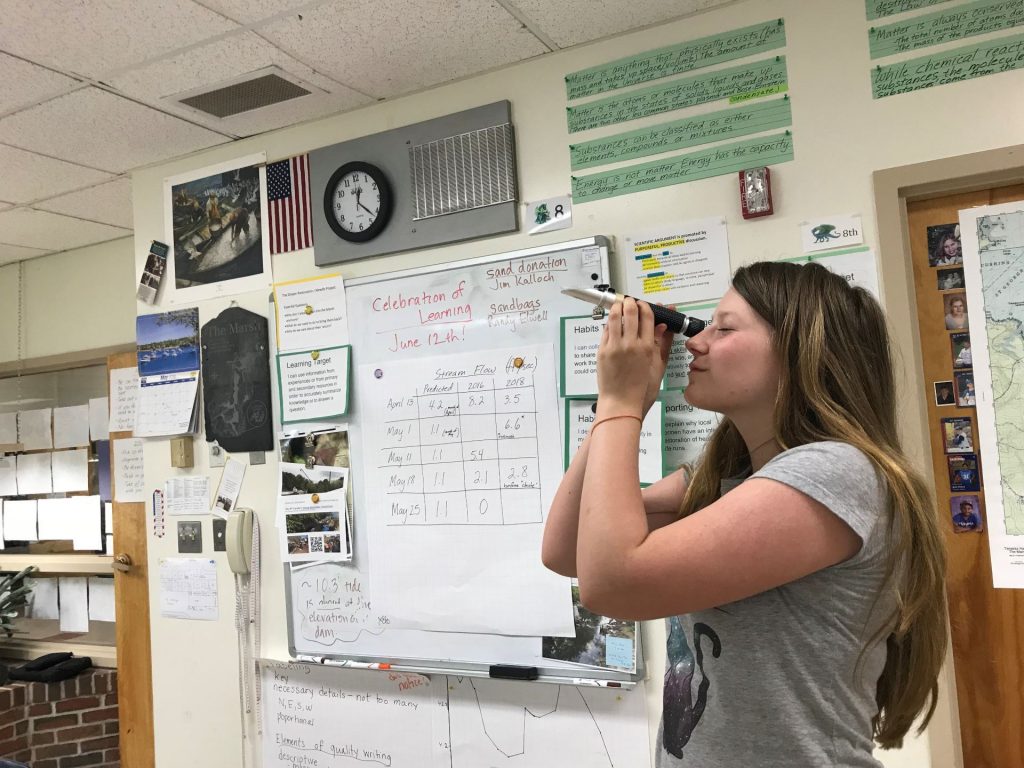
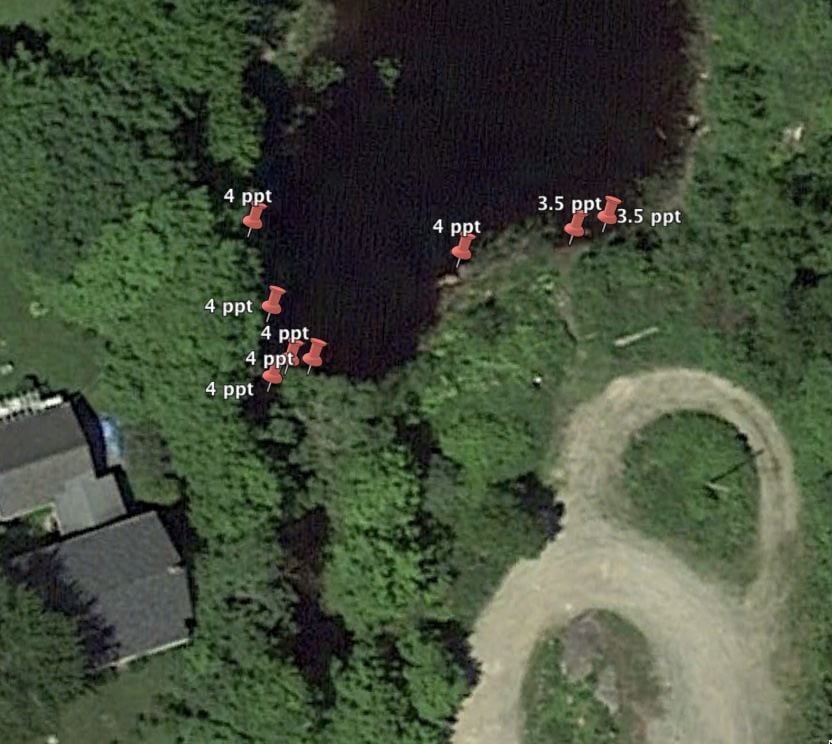
Our salinity sampling (see image above) took place on June 14th, after an 11.7  foot tide at 11:17 pm the night before.  Our sampling should reflect the influence of this tide, at a time when alewife eggs may be present in the marsh.

Alewives are in Our Pools!

Confirmation!!  We have returning alewives this spring!  Thanks to the curiosity of Madison and Breannah while on an evening bike ride past the culvert, they walked in to discover two alewives.  The next morning they reported to Mrs. England, “We are pretty sure they are alewives” and “They are big!” who promptly hugged both of them!

This was on Tuesday, June 12th, our school-wide Celebration of Learning open house for our entire St. George Community.  How fitting!  At lunchtime, any and all were invited to see if the fish were still there in the culvert.  It turned out, they were in our pools, swimming and continuing up the stream until they reached the foot of our slide.  Conservation Commission member Jonathan Coggershall was contacted and as he too looked on, he prompted the idea of netting them since we were mid-tide cycle, and a big tide wasn’t coming in until evening.

Students, some lucky 8th grade students donning hip boots and nets, watched and waited with the rest as we all enjoyed the side by side passes of the fish.  It was truly magic to see them swimming in our stream.  We watched as they made many passes near the small inlet to the final channel where the marsh waters spill into the stream.  Finally, one fish made the entry and then we were able to net it in the narrow constriction of waters.  Mila had the honor of putting that fish into the marsh.

After school was over for the day, four students were able to stay after and patiently wait for another opportunity to net.  Again, Mila was charmed and had the second fish in her net before she even realized it was there.  The sun was no longer playing on the water so directly, but keen eyes and tell-tale ripples all but erased the water between us and the fish.  Our job for this day was absolutely complete!

Video Link

Testing Salinity and Making a Claim

Contributed by Willow McConochie


CLAIM: Tides that are above 10.3 feet will flood the marsh.

EVIDENCE: We measured the salinity of water samples with refractometers on May 16th, after a 10.3 tide. Our sample 2A, taken at the upstream culvert, had 25-27 ppt of salt, 2B had 13-15 ppt. Both of the samples from the outlet at the marsh had 0 ppt of salt. We also found out that the sample at end of the culvert, on the left hand side had 7-4 ppt.  May 29th, we recorded in nine different places and all of them had 3-10 ppt of salt, and most had 3 ppt. This was very soon after a 10.6 foot tide. The location with the most ppt, was the marsh side of the dam on the right hand side, we recorded 10 ppt.

Data Table, May 16, 2018

DATE SAMLE # LOCATION PPT TEMP (ºC) GROUP
5/16 1A outlet at marsh 0 26 Willow, Gwen, Maggie/Mya, Lydia, Thomas
5/16 1B outlet at marsh 0 NA Addie, Lute, Adrien
5/16 2A upstream culvert 25

27

NA Mya, Lydia, Thomas/Addie, Lute, Adrien
5/16 2B upstream culvert 13

15

12 Willow, Gwen, Maggie/Henry, Zeke, Shaun, James
5/16 3A left of ocean, end of culvert 4

7

NA Willow, Gwen, Maggie/Henry, Zeke, Shaun, James


These points are the locations of our water samples showing their salinities

REASONING: Our 10.3 tide was an estimation; we used the rule of twelfths to estimate it. The whole tide cycle takes twelve hours, and every hour, the tide either rises or recedes 1/12. Here is the calculation: May 16 – high tide was at 12:18 pm, and was a 10.3 foot tide. At 11:15 am, we measured 26 inches of water in the culvert, 1 hour before high tide.

  • 1/12 of 10.3 = 1/12 x 10.3/1 = 0.86 feet= 10.25 inches
  • 26 + 10.25 = 36.25 inches. 36.25 inches of water will be in the culvert at  high tide.

The difference of elevation from the dam to the culvert is 3.3 feet. and there was only 36.25 inches of water in the culvert. In order for this tide to flood the marsh, there would have to be 40 inches of water in the culvert.

Additionally, if our claim wasn’t true, then all of the samples we took, that were above the dam, would have had 0 ppt of salt. And we are sure that we did the calculations correctly, and we checked the refractometer to make sure that it was reading 0 ppt with distilled water.

Investigating Salinity of a 10.6 Foot Tide

On May 28th, at 11:18 pm, a 10.6 foot tide occurred.  Our class collected water samples the next day, roughly 11 hours after this tide.  From our “rule of twelfths” and water depth measurements in the culvert, we hypothesize that tides greater than 10.3 likely flood the marsh.  We wanted to collect and test water samples from the marsh and see if any salinity could be measured.

Addie collecting a water sample on May 29th

What we found was this:

May 29th, about 11 hours after a 10.6 tide at 11:18 pm on May 28th.

Ella using a refractometer